Map view
This topic describes the purpose of the Sentinel screen's Map view and all the settings and buttons on it.
This feature requires option E14 Sentinel. If you do not have this option this feature is not available.
The Map view allows you to monitor a person's movements. It has a variety of map controls and allows you to open a number of dialog boxes which allow you to configure your Sentinel screen:
- Map Settings dialog box which allows you to configure how a variety of items are displayed on the map. When this icon is selected the icon's background is orange.
-
Views dialog box which allows you to define which views you want displayed on the Sentinel screen. It also allows you to define the default number of rows on the views.
- Field units dialog box which allows you to select which field units you want to display on the Sentinel screen.
- Auto focus dialog box which allows you to set whether or not the map automatically centers a new event on the map when it arrives.
- Case data dialog box which allows you to view an exported OSS-ESPA analysis center data on the map.
The person's current activities are marked with moving curved lines 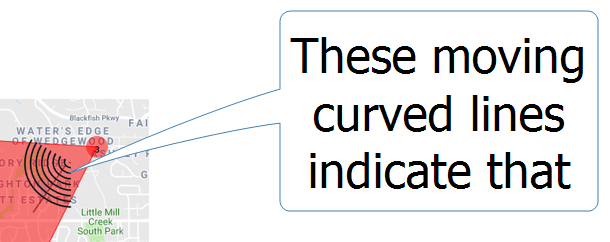 . If the current activity locations is a sector with no azimuth defined then these curved lines are displayed over 360 degrees. Current activities are defined as:
- a call or data session in progress. Note, that the map displays all the sectors that have been used during the call, not just the call's latest sector. The sector that is currently being used is displayed like this , whereas the previous sectors show no moving curved lines.
- an SMS that occurred in the previous 60 seconds.
- GPS pings that occurred in the previous 60 seconds.
The person's last known call location is marked with a moving straight line  . If the most recent location is a sector with no azimuth defined then this straight line is displayed moving over 360 degrees.
If you use the Location events view to zoom to a:
- sector or you click on a sector it displays with a solid black outline
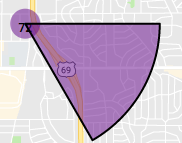 .
. - GPS ping then the GPS ping icon is larger in size than the normal
 .
.
If you have GAR units that are automatically uploading drive data to OSS-ESPA and if your administrator has configured your account to run a cell tower coverage task then once the task is run, which is typically overnight, the cell footprint maps are automatically displayed on both the Sentinel screen and the Global cell tower screen.

This filter is only displayed when Sentinel Mode is set to "Real Time".
Use to filter the location events that are displayed on the Location events view and the map.
- All: select if you want to display all the location events.
-
Current activities: select to display only the location events that are currently in progress. These are defined as:
- a call or data session in progress. Note, that the map displays all the sectors that have been used during the call, not just the call's latest sector. The sector that is currently being used is displayed like this , whereas the previous sectors show no moving curved lines.
- an SMS that occurred in the previous 60 seconds.
- GPS pings that occurred in the previous 60 seconds.
- a call or data session in progress. Note, that the map displays all the sectors that have been used during the call, not just the call's latest sector. The sector that is currently being used is displayed like this
- Recent activities: select to display only the location events that have occurred recently. You can define what is classified as recent using either the Last number of communication events or the Last number of minutes settings on the Settings dialog box.
- Last known: select to display the last known events for GPS pings, sms, data and voice calls.

Click on + or - to zoom in an out of the map. For further information refer to Zooming and panning on the Sentinel map.

Click to open a menu that allows you to open the:
- Map Settings dialog box which allows you to configure how a variety of items are displayed on the map. When this icon is selected the icon's background is orange.
-
Views dialog box which allows you to define which views you want displayed on the Sentinel screen. It also allows you to define the default number of rows on the views.
- Field units dialog box which allows you to select which field units you want to display on the Sentinel screen.
- Auto focus dialog box which allows you to set whether or not the map automatically centers a new event on the map when it arrives.
- Case data dialog box which allows you to view an exported OSS-ESPA analysis center data on the map.

Click this icon to select the add target locations mode. When the add target locations mode is selected the icon's background is orange. The add target location mode provides an additional method of adding target locations. It allows you to click a location on the map and add it as a target location. Once added, the target location is displayed on the Locations of interest view and the Locations section of the Manage case screen. For further information refer to Adding target locations using the map.

Click this icon to select the measure distance mode. When the measure distance mode is selected the icon's background is orange. The measure distance mode allows you to estimate distances on the map. For example, it is useful for estimating the distance a cell covers, or the distance between cells. For further information refer to Measuring distance on the Sentinel map.

Click this icon to select the normal map operation mode. When normal map operation is selected the icon's background is orange. Normal map operation mode allows you to do such things as view sector and target information.

Click to open a view which allows you to select which map layers you want displayed. For further information refer to Viewing different map layers on the Sentinel screen.

If you have set an anchor on a location of interest using the anchor menu then click to center the anchor on the map's display. For further information refer to Setting an anchor.

Click to export the currently displayed map:
- Export current map view: Click to download a .png file containing the current map view to your browser.
- Export KMZ: This option is only available when the Sentinel Mode is set to Historical. Click to export the currently selected map layers to a KMZ format that you can then use in Google Earth or MapPoint. Everything is exported whether or not they are in the current zoom area of the Sentinel screen's map.
-
Export to e-mail: Click to export and email the current map view. The Email recipients dialog box opens allowing you to define which users and other email addresses the map is sent to.
You can choose to include both Embed image and Embed public URL:
-
Embed image provides a png, the same as is provided with Export current map view.
-
Embed public URL contains a link to an interactive map viewer.
-


Click to either lock or unlock the map's location and zoom setting.
When set to the locked position the map location and zoom remain the same as you have them currently displayed on the map. This can be useful for a number of reasons, for example: you may wish to monitor movements around a specific location, or it may give you a better overall view of the location of a new event when it occurs rather than it zooming in closely to the event which may make it difficult for you to at first determine the new location relative to the previous one.

Click to set the zoom to include all data boundaries centralized in the map.
Click to display the details of all the current activities.
If a communication has a red outline it indicates that it is an SMS or VoIP communication. This warns you that if you are using OTA equipment you may want to switch it off or pause its radios, as the target device may drop the call and alert its user.
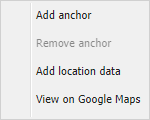
Right-click the map to display this menu which allows you to:
- add and remove an anchor on the map. An anchor can be used to identify an important location that you can easily jump to by clicking . For further information on using anchors refer to Setting an anchor.
- add location data for GPS pings and timing advance arcs. This is useful if you've contacted the service provider for the latest location data and rather wait for them to send it to you, it allows you to enter it manually. When you click Add location data, the New location data dialog box opens with the latitude, longitude and time automatically completed.
- view the location on Google Maps. This is useful as it provides you with a visual display of the landscape.
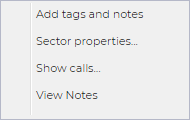
If you right-click on any sector displayed on the map a menu displays with the following options:
-
Add tags and notes
Click to add a tag or note to the selected item. For further information refer to Add tag and note dialog box.
-
Sector properties...
Click to open the sector pop-up which allows you to view the details of the sector.
-
Show calls...
Click to show all the sector's calls and their details.
-
View notes
Click to open the View tags and notes dialog box which allows you to view, edit and delete any tags and notes that have been added to the sector.

This IP icon displays for the IPs that you select the check-box for on the IPs view.
What these IP addresses represent is dependent on the data source. If the data source is:
-
ELSUR, then the IP address is the one which the person is accessing.
-
social media, then the IP address is where the person may be located.
Click the icon to open the dialog in the following graphic that includes all the events for that IP address.
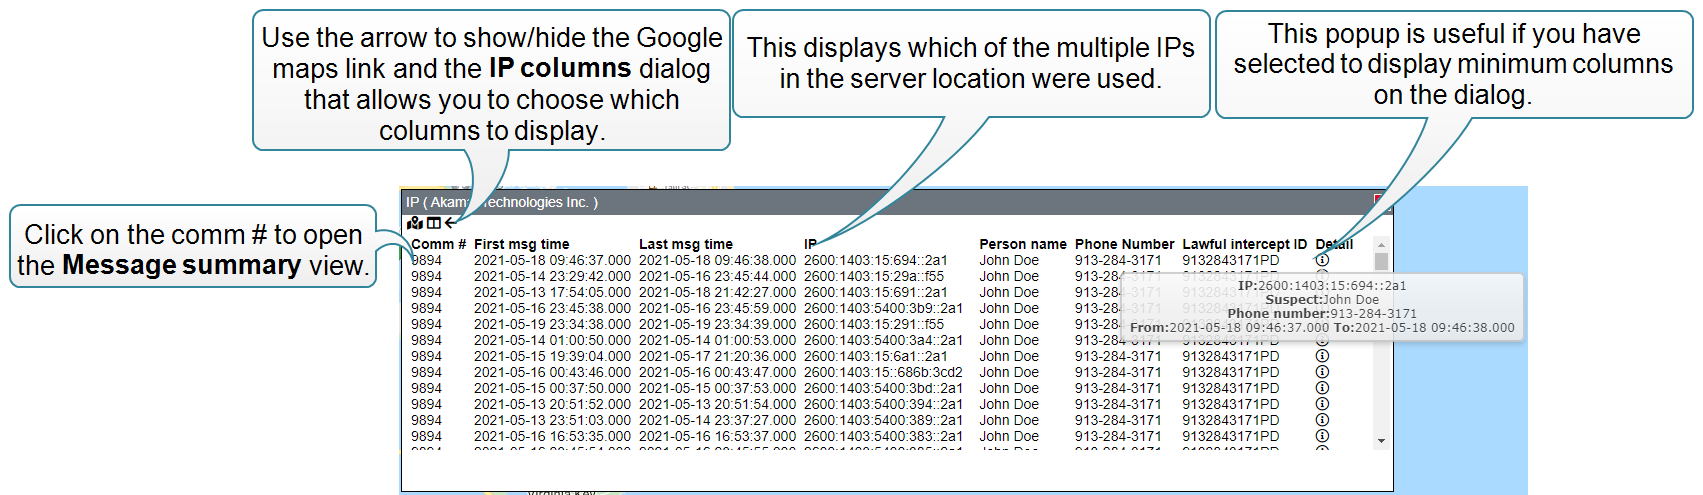
Click  at the top-left of the dialog to display two button which allow you to:
-
 open the location for further investigation in Google Maps.
 -
 open the IP columns dialog box that allows you to select which columns are displayed on the IP dialog.

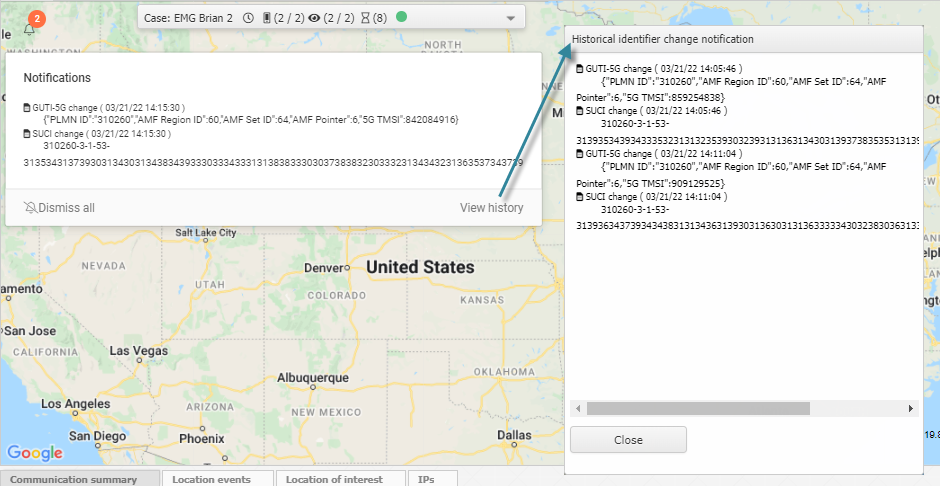
This alert notification appears automatically if there is any change to a device's subscriber information (IMSI, MSISDN, SUPI-IMSI, GPSI-MSISDN, SUCI, GUTI-5G) and the device information (IMEI, IMEISV, PEI-IMEI, PEI-IMEISV). This type of alert notifies you of pertinent changes related to the target device which may require you to reconfigure other equipment in order to accomplish your mission.
The subscriber information can change when the target changes the SIM card or any temporary identifier related to the SIM card managed by the operator. The most current IMSI, GUTI or SUCI (5G) number is required if you want to locate the phone with cell tracking equipment.
The device information is related to the phone model or device in use with the subscriber identifier, and is required to configure the cell tracking equipment with regards to the device's supported technologies and limitations.
When you click the notification, it opens the Notifications pop-up which displays the most recent changes. Click on the value if you want to copy it to your clipboard to use elsewhere. Click View history if you want to view any previous changes. Click Dismiss all to remove the alert notification from the screen and to also clear the historical alarms.